content type highlightpublished May 20, 2021
Making Mobile Applications Accessible with Machine Learning
Making Mobile Applications Accessible with Machine Learning
At Apple we use machine learning to teach our products to understand the world more as humans do. Of course, understanding the world better means building great assistive experiences. Machine learning can help our products be intelligent and intuitive enough to improve the day-to-day experiences of people living with disabilities. We can build machine-learned features that support a wide range of users including those who are blind or have low vision, those who are deaf or are hard of hearing, those with physical motor limitations, and also support those with cognitive disabilities.
Mobile devices and their apps have become ubiquitous. And, for the estimated 15% of the world population with a disability, many capabilities and services offered by apps remain inaccessible.
To provide benefit to users, accessibility features on mobile platforms need apps to provide complete and accurate information that describes user interface (UI) components. But, many apps do not provide sufficient descriptions for accessibility features to work as expected. When developers don’t provide accurate information on individual UI elements, parts of the app is not accessible. This could result in VoiceOver being unable to read a paragraph, or Switch Control being unable to activate a button. In some cases, an entire app cannot be accessed by users with disabilities.
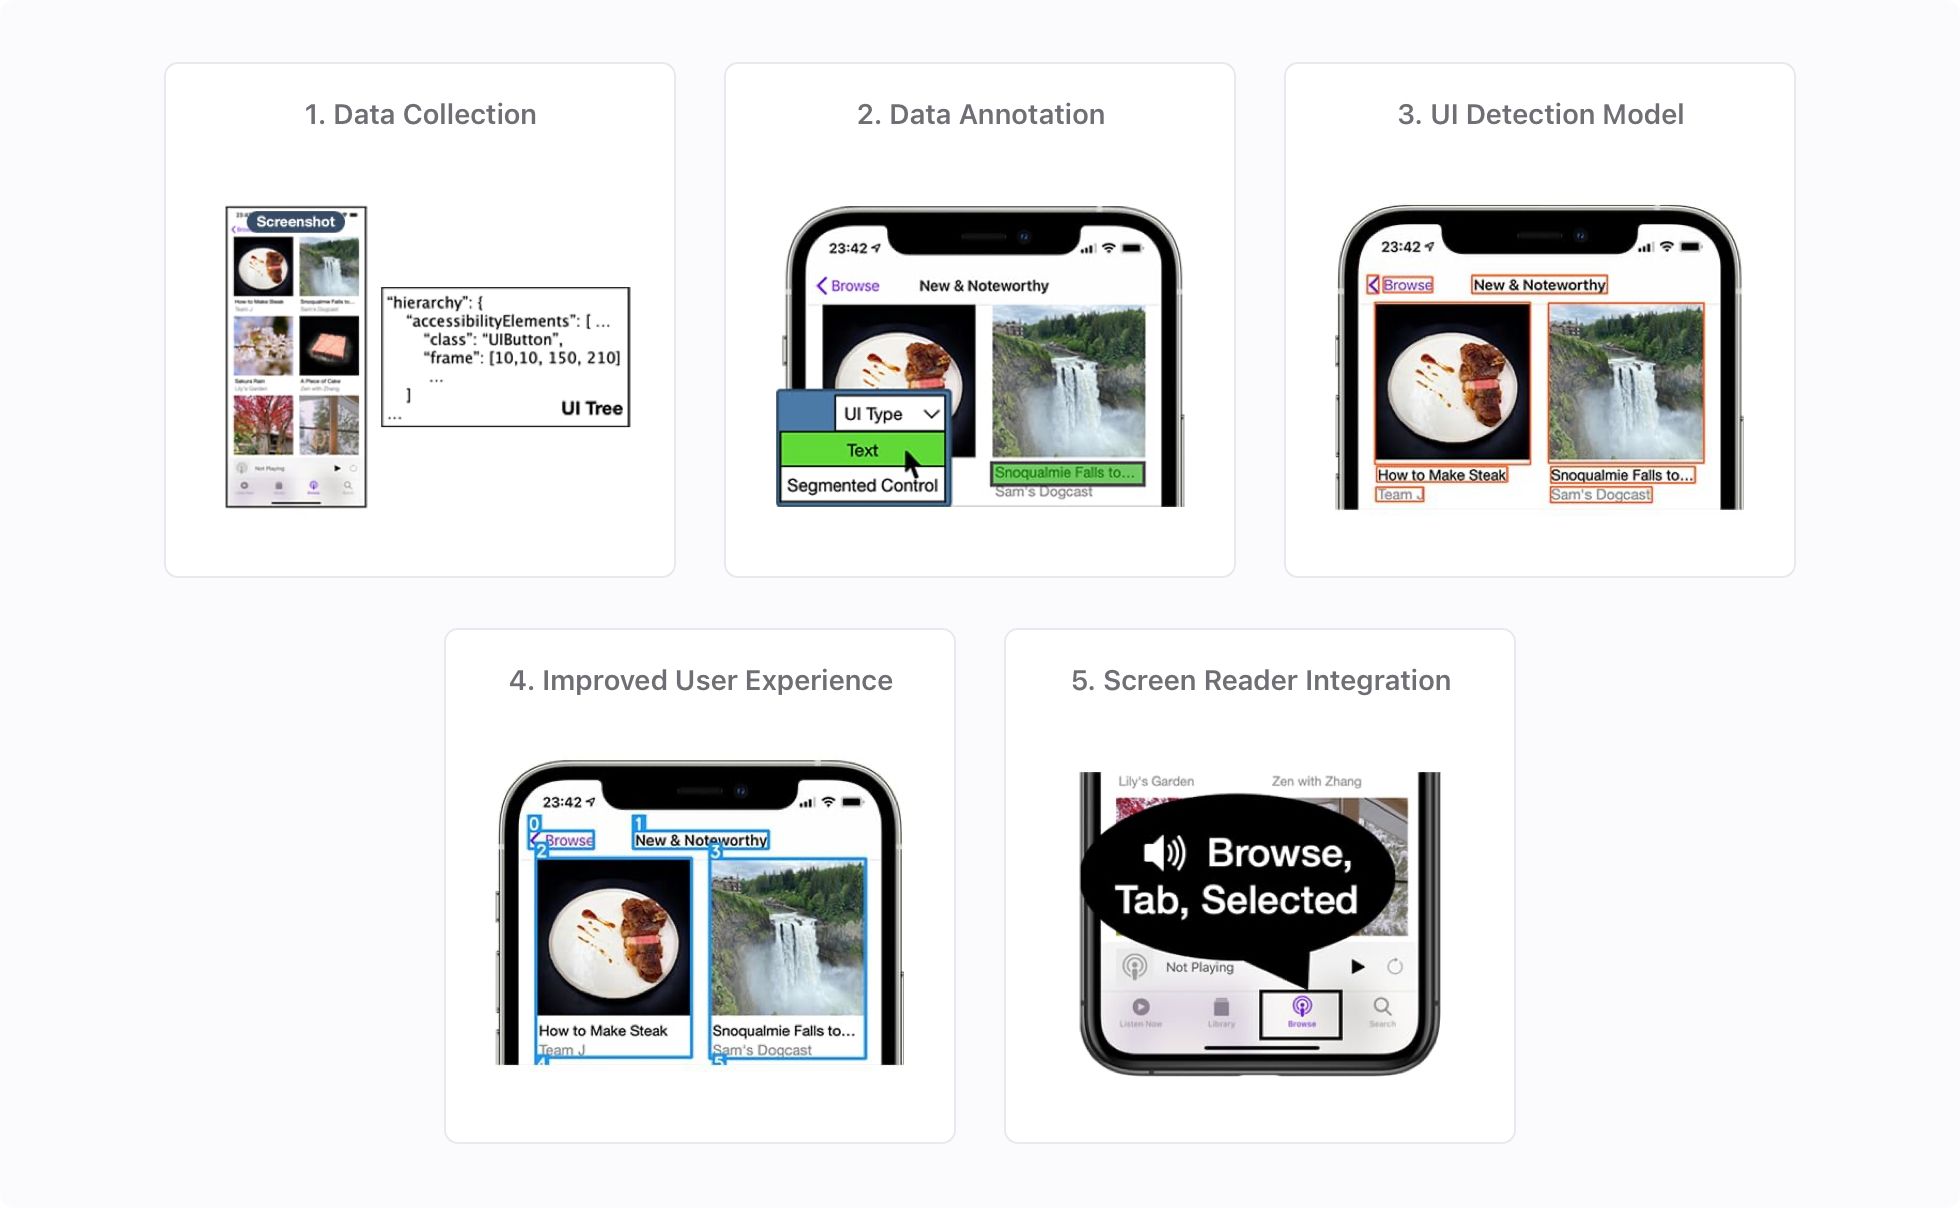
We conducted a study to explore inferring accessibility for mobile apps from their onscreen pixels. We trained a robust, fast, memory-efficient, on-device model to detect UI elements using a dataset of manually collected and annotated screens from iPhone apps. To further improve UI detections and added semantic information, we introduced heuristics and additional models. For example, we grouped relevant UI elements together to save navigation time for screen reader users, and recognized whether a UI element is clickable.
From this study, we built the Screen Recognition feature, which we shared to the public in iOS 14. Screen Recognition uses machine learning and computer vision to automatically detect and provide content readable by VoiceOver for apps that would otherwise not be accessible.
To train and test our UI detection model, we created a dataset of 77,637 screens from 4,068 iPhone apps. The dataset contained captured app screenshots and extracted information of UI trees and accessibility trees. We manually annotated the visual UI elements on the screens.
We manually downloaded and installed the top 200 most-downloaded free apps for each of 23 app categories (excluding games and augmented-reality (AR) apps) presented in the U.S. App Store from December 9, 2019 to January 13, 2020. To ensure privacy for our screen collection analysts, we did not include apps that required credit card information (for in-app payment, for example) or other sensitive personal information (log-ins for banking apps, personal health data, and so on).
We manually traversed our screen collection analysts’ screens in each app to collect screen information using custom software we built. For each traversed screen, our software collected a screenshot and metadata about UI elements. The metadata included a tree structure of all exposed UI elements on the screen, and properties of each UI element.
We annotated all visually discernible UI elements in the screenshots. First, we determined a bounding box for each UI element. To improve consistency across annotations, the annotation tool suggested a bounding box provided by a captured UI element, when an appropriate one was available. When no bounding box was available for a UI element, the annotators manually drew a box. Second, for each UI element, we assigned one of 12 common types based on visual inspection: checkbox, container, dialog, icon, picture, page control, segmented control, slider, text, text field, tab-bar item, and toggle.
To better understand the composition of our dataset, we conducted two analyses. The first analysis explored our dataset biases between different UI-element types, which could impact our model performance. The annotations revealed an imbalance of element types in app screens. Text has the highest representation (741,285 annotations), and sliders have the lowest (1,808 annotations). The top four UI element types comprised 95% of annotations. We considered data imbalances in model training to improve performance on underrepresented element types.
Our second analysis examined discrepancies between annotations and UI element metadata for each screen to estimate how many UI elements were not available to accessibility services. Fifty-nine percent of screens had annotations that did not match any accessible UI element. We found that 94% of the apps in our dataset had at least one such screen, rather than just a few unusable apps contributing to a large number of these screens.
We created a robust, fast, memory-efficient, on-device model to detect UI elements. We started by experimenting with Faster R-CNN and its extension, Mask R-CNN, which is one of the highest-performance object detection models evaluated on public datasets. Faster R-CNN takes more than one second for each screen and more than 120 MB of memory, both of which are unsuitable for on-device inference. We then experimented with the TuriCreate Object Detection toolkits, which are easy to use and are optimized for iOS devices. The TuriCreate model uses approximately half the memory (60 MB) and has a significantly faster inference time (around 20 milliseconds).
For a more efficient model with tighter bounding box predictions and a higher mean Average Precision (mAP), we converged on a Single Shot MultiBox Detector (SSD) model that met our requirements. Specifically, we used MobileNetV1 (instead of large ResNet) as a backbone to reduce memory usage. Another common challenge in object detection tasks is detecting small objects. Unfortunately, UI elements are relatively small compared to most targets seen in object detection tasks. We used the Feature Pyramid Network (FPN) feature extractor, which is designed with a hierarchical pyramid to improve accuracy and speed when detecting objects at different scales. To handle class-imbalanced data, we performed data augmentation on underrepresented UI element types during training, and applied a class-balanced loss function (applying more weight to underrepresented element types).
Our final architecture uses only 20MB of memory (as a Core ML model), and takes only about 10ms per screen for inference (on an iPhone 11 running iOS 14). To train this model, we used 4 Tesla V100 GPUs for 20 hours (providing 557,000 iterations). Object detection models often return multiple bounding boxes for a given underlying target, with different confidences. We used two post-processing methods to filter out duplicate detections: (i) Non-Max Suppression picks the most confident detection from overlapping detections, and (ii) Different confidence thresholds can be applied on each UI type to remove less-certain detections. As shown in Figure 4, we picked confidence thresholds per UI element type that balance recall and precision for each.
For each UI element type, we evaluated our model performance using Average Precision (AP), a standard object detection evaluation metric. We chose a threshold of > 0.5 IoU (Intersection over Union), commonly used in object detection challenges, to match a detection with a ground truth UI element. On our testing dataset (containing 5,002 screenshots), our UI detection model achieved 71.3% mean AP. When we weighted our results by the frequency of each UI element type in the dataset, the weighted mAP was 82.7%. Table 1 shows the individual AP for each of the 13 UI types. Based on the precision-recall (PR) curves for individual UI element types (as shown in Figure 4), we chose a different confidence threshold for each element type. The use case of screen-reader accessibility informed our choices. Different thresholds might be better for other accessibility services (for example, SwitchControl users might favor precision over recall to reduce the number of elements to navigate when they can see elements that our model fails to detect).
| UI Type | AP (>0.5 IOU) | AP (Center) | Count |
|---|---|---|---|
| Checkbox (unselected) | 77.5% | 79.1% | 471 |
| Checkbox (selected) | 27.4% | 27.4% | 119 |
| Container | 82.1% | 83.0% | 11,528 |
| Dialog | 62.9% | 63.3% | 264 |
| Icon | 79.7% | 88.0% | 21,875 |
| Page Control | 65.4% | 87.3% | 454 |
| Picture | 72.0% | 76.9% | 9,211 |
| Segmented Control | 55.1% | 57.6% | 1,036 |
| Slider | 55.6% | 63.0% | 110 |
| Text | 87.5% | 91.7% | 47,045 |
| TextField | 79.2% | 79.5% | 1,379 |
| Toggle (unselected) | 91.7% | 91.7% | 247 |
| Toggle (selected) | 90.5% | 92.0% | 131 |
| Mean | 71.3% | 75.4% | |
| Weighted Mean | 87.5% | 83.2% |
Our model achieved the lowest AP for the checkbox (selected) element. Its low frequency in the dataset might have contributed to poor model performance; however, the slider and toggle elements, which fared better, had a similar low frequency. To further understand how much the model misclassifies one UI element type as another, we generated a confusion matrix. We found that the model often confused checkbox (selected) with icon, and sometimes with picture. Checkboxes look visually similar to icons, potentially explaining why our model tended to misclassify them as icons—which have much higher frequency in the dataset. We saw that creating a dedicated classification model to distinguish checkbox (selected) from icon has the potential to double the model’s recall.
We also evaluated our model’s detection performance with a metric specific for accessibility services: whether the center of a detection lies within its target UI element. With mobile screen readers, double-tapping a detected element passes a tap event to its center, which activates the target. This evaluation metric is more relaxed than > 0.5 IoU and increased the mean AP from 71.3% to 75.4%, as shown in column AP (Center) of Table 1. In some cases, the detection bounding box might not be tight enough to include all semantic information of a target UI element, but still enables users to manipulate the target. Thus, this metric may better capture whether the model enables people to use the manipulable UI elements.
Presenting UI detection directly to screen readers doesn’t provide an ideal user experience, because the model doesn’t provide comprehensive accessibility metadata (UI content, state, clickability, and so on). We worked with three blind QA engineers and two senior accessibility engineers to iteratively uncover and design the following improvements to provide a better screen reader experience. Over five months, the participating engineers tried new versions of the model on apps of their choice, and provided feedback on when it worked well and how it could be improved.
Prior work has explored recognizing UI content in order to generate labels or natural language descriptions. In our feature, we also recognized content for three main UI element types. For text, we used the iOS built-in OCR engine, which provided a tight bounding box and accurate text result with a reasonable latency (< 0.5s). For the icon type, we use the Icon Recognition engine in VoiceOver (in iOS 13 and later) to classify 38 common icon type. For the picture type, we used the Image Descriptions feature in VoiceOver (in iOS 14 and later) to generate full-sentence alternative text.
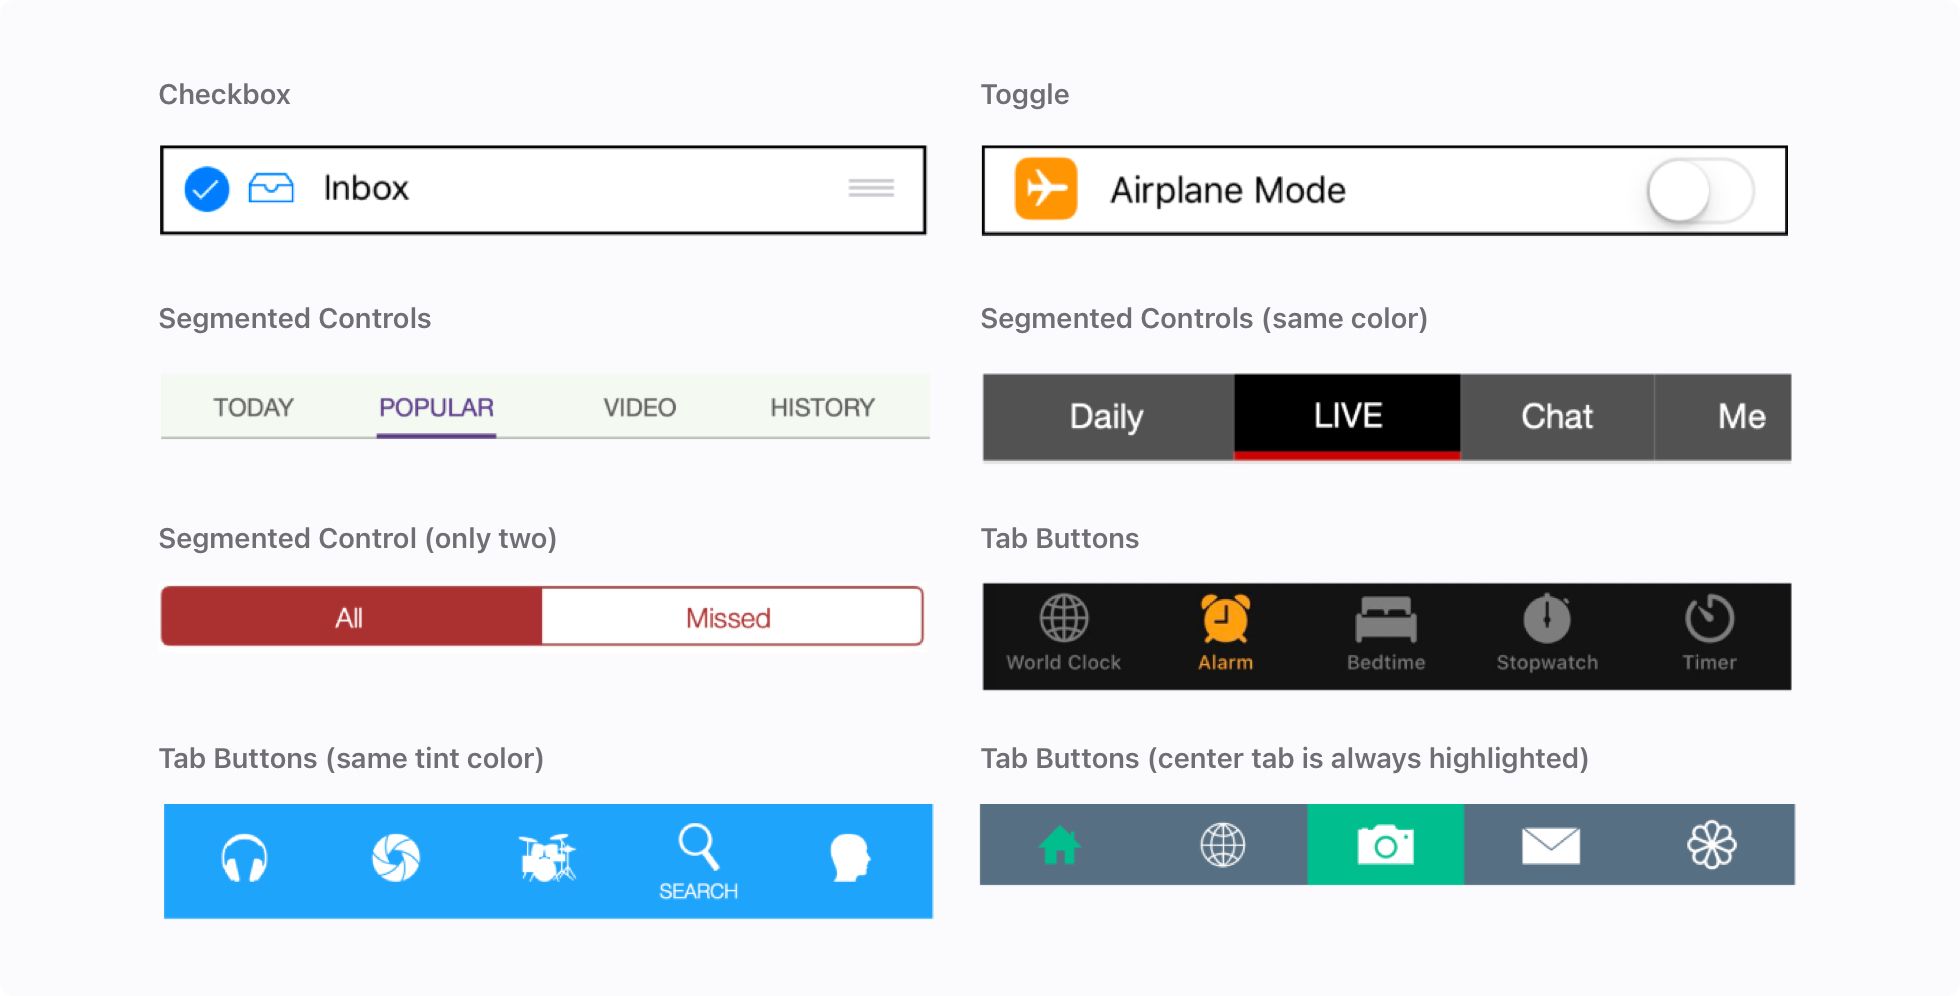
As shown in Figure 5, several UI element types also have selection states. These include the toggle, checkbox, segmented control, and tab button types. We leveraged their visual information to determine the selection states (tint color, UI detection type, and so on). We evaluated our selection state heuristics, and found that the recall of selection state is 90.5% for tab buttons and 73.6% for segmented controls.
Knowing whether a UI element is interactive is important for screen reader users. To predict icon clickability, we trained a Gradient Boosted Regression Trees model with several features (location, size, Icon Recognition result). This model was trained with TuriCreate Boosted Trees Classifier toolkits (using 10ms inference time and 10MB memory). We marked an icon element as clickable only when our model was confident, to benefit of screen reader users, who tend to prefer precision over recall. Therefore, we picked a threshold for our model to maintain 90.0% precision, which allowed 73.6% recall.
Grouping related UI elements makes navigation more efficient for screen readers and other accessibility services. Figure 6 shows the original detections from our UI element detection mode. Navigating through a large amount of such detections would take a long time for screen reader users. To reduce the number of UI elements in navigation, we grouped related elements together. We developed multiple heuristics that group UI detections based on their UI element types, sizes, and spatial relationships on the screen. Figure 6 interactively shows the results of our grouping heuristics on example screens.
Mobile screen readers allow swiping to navigate all UI elements on a screen in a logical order for the user. Therefore, we needed to provide our detected UI elements to screen readers in a reasonable navigation order. After applying our grouping heuristics, we determined the navigation order by using a widely used optical-character recognition (OCR) algorithm, the XY-cut page segmentation algorithm, which sorts text/picture blocks of a document in human reading order. We applied the algorithm to our problem, as illustrated in Figure 6.
Our technical and user evaluation methods demonstrate that this approach is promising, and can make inaccessible apps more accessible through machine learning. Our work illustrates a new approach for solving a long-standing accessibility problem, which has implications across a number of different platforms and services.
In our study, one participant chose to try an app they knew to be accessible. The participants compared Screen Recognition favorably to regular VoiceOver, noting that Screen Recognition exposed certain features in a different and useful way. “It was fun to discover the contents of the profile pictures displayed next to the person name and understand the layout of the app,” the participant shared. “With [Screen Recognition] we now have the ability to understand the app spatially in addition to contextually.”
Another participant shared their excitement about enabling Screen Recognition on a gaming app that did not have any accessibility elements, writing “Guess who has a new high score? I am in awe! This is incredible.” The participant went on, “It is the first mainstream game I’ve ever been able to play on iOS…”
Moving forward, we’d like to use the auto-generated accessibility metadata to not only directly impact accessibility features, but also help app developers make their apps more accessible from the start. The most accessible experiences are created by app developers who understand the design, understand how content can best be conveyed to meet users’ needs, and who design an accessibility experience for their users.
Many people contributed to this work, including Xiaoyi Zhang, Lilian de Greef, Amanda Swearngin, Samuel White, Kyle Murray, Lisa Yu, Qi Shan, Jeffrey Nichols, Jason Wu, Chris Fleizach, Aaron Everitt, and Jeffrey P. Bigham.
Alexander Neubeck and Luc Van Gool. 2006. Efficient non-maximum suppression. In 18th International Conference on Pattern Recognition (ICPR’06), Vol. 3. IEEE, 850–855. [link].
Apple. 2020. Boosted Trees Classifier. [link].
Apple. 2020. iOS 14 Preview - Features. [link].
Apple. 2020. Recognizing Text in Images. [link].
Apple. 2020. Turi Create. [link].
Apple. 2020. Use Switch Control to navigate your iPhone, iPad, or iPod touch. [link].
Apple. 2020. Vision Accessibility - iPhone. [link].
Chunyang Chen, Sidong Feng, Zhenchang Xing, Linda Liu, Shengdong Zhao, and Jinshui Wang. 2019. Gallery D.C.: Design Search and Knowledge Discovery Through Auto-created GUI Component Gallery. Proceedings of the ACM on Human-Computer Interaction 3, CSCW (Nov. 2019). [link].
George Nagy and Sharad C. Seth. 1984. Hierarchical Representation of Optically Scanned Documents. Proceedings of the 7th International Conference on Pattern Recognition (1984), 347–349. [link].
Jaekyu Ha, Robert M Haralick, and Ihsin T Phillips. 1995. Recursive XY Cut Using Bounding Boxes of Connected Components. In Proceedings of 3rd International Conference on Document Analysis and Recognition (ICDAR ’95, Vol. 2). IEEE, 952–955.
K He, G Gkioxari, P Dollar, and R Girshick. 2017. Mask R-CNN. In 2017 IEEE International Conference on Computer Vision (ICCV). 2980–2988. [link].
Richard E. Ladner. 2015. Design for User Empowerment. Interactions, 22(2), 24-29. [link].
Santiago. 2018. Confusion Matrix in Object Detection with TensorFlow. [link].
Shaoqing Ren, Kaiming He, Ross Girshick, and Jian Sun. 2015. Faster r-cnn: Towards real-time object detection with region proposal networks. In Advances in neural information processing systems. 91–99. [link].
Thomas F. Liu, Mark Craft, Jason Situ, Ersin Yumer, Radomir Mech, and Ranjitha Kumar. 2018. Learning Design Semantics for Mobile Apps. In Proceedings of the 31st Annual ACM Symposium on User Interface Software and Technology (UIST ’18). Association for Computing Machinery, New York, NY, USA, 569–579. [link].
World Health Organization. (2011). World Report on Disability. [link].
Wei Liu, Dragomir Anguelov, Dumitru Erhan, Christian Szegedy, Scott Reed, Cheng-Yang Fu, and Alexander C Berg. 2016. SSD: Single shot multibox detector. In European conference on computer vision. Springer, 21–37.
Xiaoyi Zhang, Lilian de Greef, Amanda Swearngin, Samuel White, Kyle Murray, Lisa Yu, Qi Shan, Jeffrey Nichols, Jason Wu, Chris Fleizach, Aaron Everitt, Jeffrey P. Bigham. 2021. Screen Recognition: Creating Accessibility Metadata for Mobile Applications from Pixels. In Proceedings of the 2021 CHI Conference on Human Factors in Computing Systems. [link].
Yang Li, Gang Li, Luheng He, Jingjie Zheng, Hong Li, and Zhiwei Guan. 2020. Widget Captioning: Generating Natural Language Description for Mobile User Interface Elements. Conference on Empirical Methods in Natural Language Processing (EMNLP 2020). [link].
Screen Parsing: Towards Reverse Engineering of UI Models from Screenshots
September 29, 2021research area Accessibility, research area Human-Computer Interactionconference UIST
Automated understanding of user interfaces (UIs) from their pixels can improve accessibility, enable task automation, and facilitate interface design without relying on developers to comprehensively provide metadata. A first step is to infer what UI elements exist on a screen, but current approaches are limited in how they infer how those elements are semantically grouped into structured interface definitions. In this paper, we motivate the…
Screen Recognition: Creating Accessibility Metadata for Mobile Applications from Pixels
March 1, 2021research area Accessibility, research area Human-Computer Interactionconference CHI
Many accessibility features available on mobile platforms require applications (apps) to provide complete and accurate metadata describing user interface (UI) components. Unfortunately, many apps do not provide sufficient metadata for accessibility features to work as expected. In this paper, we explore inferring accessibility metadata for mobile apps from their pixels, as the visual interfaces often best reflect an app’s full functionality. We…

Our research in machine learning breaks new ground every day.